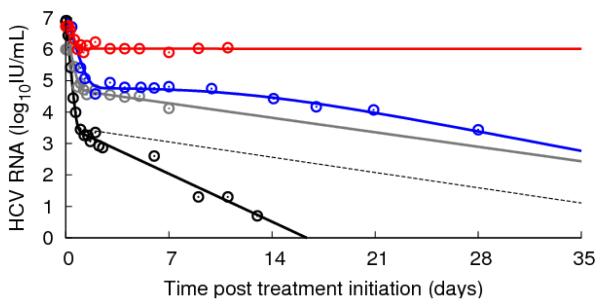
Figure 2.
Representative examples of viral kinetics patterns under treatment. HCV RNA digitalized data (circles) and their corresponding fits by the standard or extended model. Grey: biphasic responder with (daily) 10 MIU IFN (6) (ε=0.95, δ=0.16 d−1, c=5.6 d−1) (standard model); red: flat responder with (daily) 10 MIU IFN (70) (standard or extended model); blue: triphasic responder with (daily) 10 MIU IFN (6) (extended model); black: telaprevir plus (weekly) peg-IFNα-2a for 14 days (48) (ε=0.999, δ=0.5 d−1, c=11 d−1) (standard model); black dashed line: viral kinetics decline if the second phase viral decline was similar to what is observed with IFN (ε=0.999, δ=0.16 d−1, c=11 d−1).

