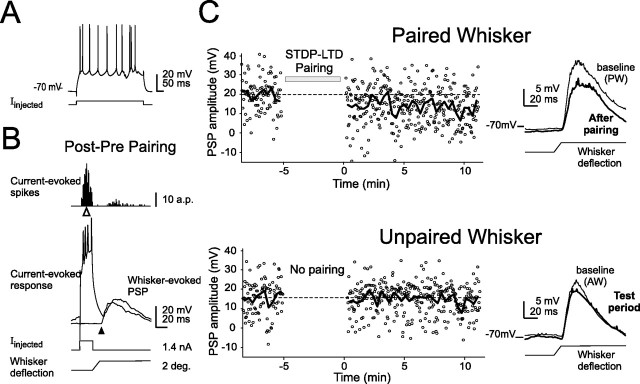
Figure 6.
Induction of spike timing-dependent synaptic depression in a representative neuron. A, Firing pattern in response to 500 ms current injection. B, Pairing protocol in which current-evoked spikes preceded the PW-evoked PSP. Histogram, Distribution of times of all evoked spikes, relative to PSP onset (black arrowhead), during pairing. Mean Δt for this cell was −26 ms (white arrowhead). C, Results of pairing. The amplitude of each wPSP during the experiment (small points) and the average of each 10 trials (thick line) for the paired PW (top) and unpaired AW (bottom) whiskers are shown. Right, wPSP averaged over 50 trials during baseline (thin line) and after pairing (thick line).

