
Figure 1.
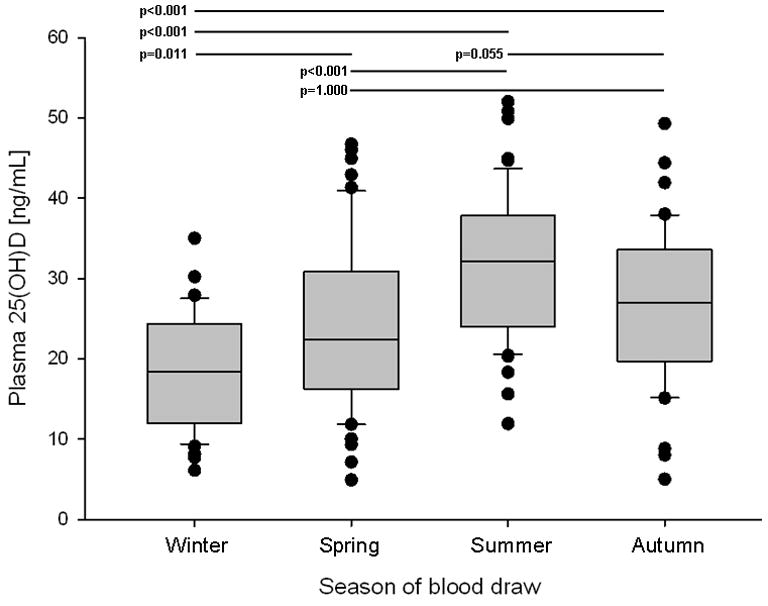
Boxplots of 25(OH)D levels by season. Line=median, shaded box=interquartile range, whiskers=range, dots=outliers. Winter=January-March, Spring=April-June, Summer=July-September, Autumn=October-December. Results of statistical testing of means listed in Table 3 (one-way ANOVA with Bonferroni-corrected p-value) displayed at top with p-value and corresponding line to indicate the comparison tested. 25(OH)D = 25-hydroxyvitamin D.