
Figure 3.
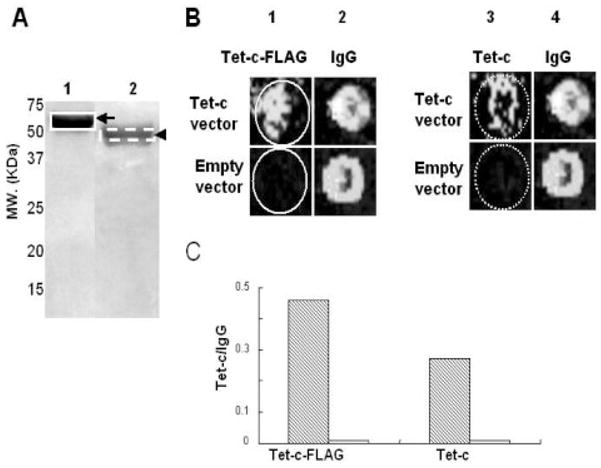
Printing microarrays with SDS-PAGE gel eluted Tet-c. Purified Tet-c-FLAG (A, lane 1) and Tet-c (A, lane 2) (50 μg) were loaded onto a 10% SDS-PAGE gel and stained with CBB R250. Tet-c-FLAG and Tet-c were then extracted by gel elution as described in Section 2. The gel-eluted Tet-c-FLAG (B, lane 1) and Tet-c (B, lane 3) (0.35 μg) were spotted on a microarray. Spotting IgG (0.7 μg) (B, lanes 2 and 4) serves as a positive control. The antigen microarrays printed with IgG as well as gel-eluted Tet-c-FLAG and Tet-c were incubated with mouse sera (100-fold dilution), which were collected 9 weeks post-immunization with a Tet-c vector (Tet-c vector) and an empty vector (empty vector). The intensities of fluorescent signals (green dots) reflecting the level of Tet-c antibodies are represented by a ratio (Tet-c/IgG) of those of Tet-c (hatched bar) to IgG (open bar) (C). Data are representative of three independent experiments with similar results.