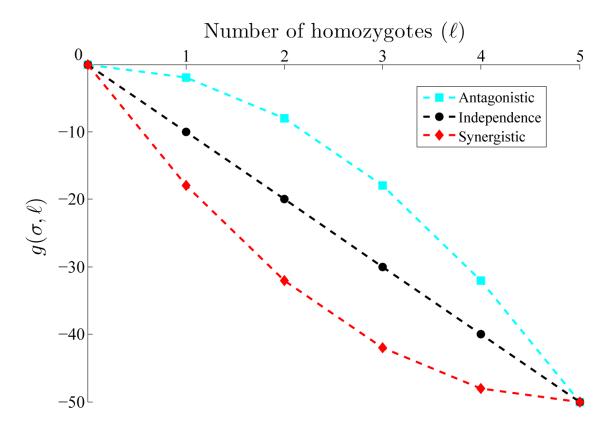
Figure .2.
Epistasis as a function of the number of homozygotes, ℓ, in a multi-locus genotype (m = 5, σ = 10). The plot shows linear and quadratic forms of the function g(σ, ℓ), describing epistasis corresponding to antagonistic interaction (cyan), independence (black) and synergistic interaction (red).

