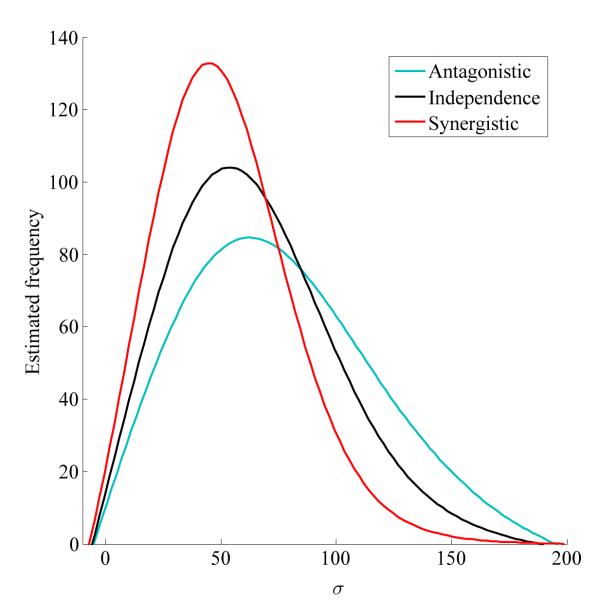
Figure .4.
Kernel density estimates (using Gaussian Kernel) of posterior samples of σ under antagonistic (cyan), independence (black) and synergistic (red) models for the HLA/KIR data. The 95% HPD intervals (obtained from the original sample without density estimation) are {29, 143} for antagonistic epistasis, {24, 115} for independence, and {20, 98} for synergistic epistasis (100,000 MCMC iterations with thinning at every 100th step).

