Figure 5.
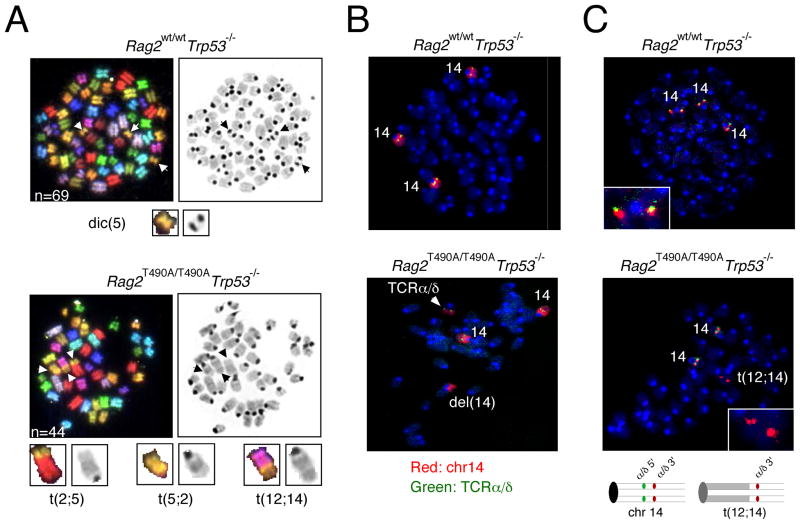
A t(12;14) translocation splits the TCRα and TCRδ locus in a T cell lymphoma from a p53-deficient, RAG-2 T490A mouse. (A) Spectral karyotypic (SKY) analysis of metaphase chromosomes from tumor 2319 (Rag2wt/wtTrp53−/−; upper panels) or tumor 2297 (Rag2T490A/T490ATrp53−/−; lower panels). SKY images are shown at left and DAPI-stained images at right. Arrows, aberrant chromosomes; n, ploidy. Enlarged images of each aberrant chromosome are given below; chromosomal origins are indicated; t, translocation; dic, dicentric. The karyotypic analyses of all tumors examined in this study are summarized in Table 1. (B) Translocation breakpoint of t(12;14) translocation in tumor 2297 lies at or near the TCRα and TCRδ locus. Fluorescence in situ hybridization (FISH) to metaphase chromosome spreads from Rag2wt/wtTrp53−/− tumor 2319 (upper panel) or Rag2T490A/T490ATrp53−/− tumor 2297 (lower panel) using a TCRα and TCRδ-specific probe (green) and a chromosome 14-specific probe (red). Normal chromosomes 14 (14), the deleted portion of chromosome 14 (del[14]) and the position of the TCRα and TCRδ locus are indicated. (C) The t(12;14) translocation breakpoint in tumor 2297 lies within the TCRα and TCRδ locus. FISH was performed against metaphase chromosome spreads from Rag2wt/wtTrp53−/− tumor 2319 (upper panel) or Rag2T490A/T490ATrp53−/− tumor 2297 (lower panel) using probes specific for the 5′ (green) or 3′ (red) regions of the TCR α and TCRδ locus. The inset in the upper panel represents an enlarged image of intact chromosome 14, exhibiting superimposed signals from 5′ and 3′ probes. The inset in the lower panel represents an enlarged image of the t(12;14) translocation, which hybridized only to the 3′ probe. The deduced arrangements of hybridized probes in intact chromosome 14 and the t(12;14) translocation are diagrammed below.

