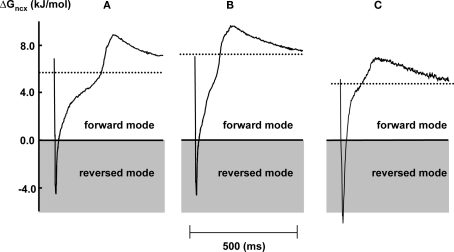
Figure 4.
Representative examples of the dynamic change of ΔGncx in 2 Hz stimulated myocytes during one stimulation cycle, under aerobic condition (A) and after 2 (B) and 10 (C) min of metabolic inhibition. The dotted area corresponds to reversed mode operation of NCX. The dotted lines represent time averaged ΔGncx over one stimulation cycle.

