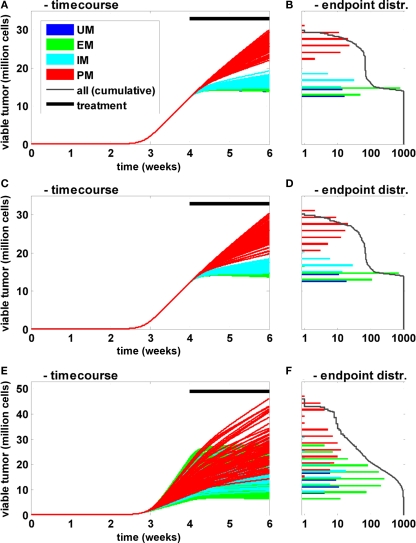
Figure 6.
Influence of CYP2D6 activity on the population level. Time courses (A,C,E) of viable tumor and frequency distribution of endpoints on a logarithmic scale (B,D,F) after 4 weeks of untreated tumor growth followed by a 2-week bi-daily treatment period are shown for a population of 1000 individuals. The activity differences for CYP2D6 between PM, IM, EM, and UM were derived according to Zanger et al. (2001). The frequency of the different metabolizers was according to Sistonen et al. (2007) for Europeans. In (A) only clearance was varied between the individuals. In (C) additional physiological parameters (organ volumes and composition, blood flows, etc.) were varied independent of the metabolizers’ phenotype according to Willmann et al. (2007b, 2009a). In (E) the concentrations of the proteins involved in EGFR signal transduction were varied in addition to the two before mentioned sources of variability.

