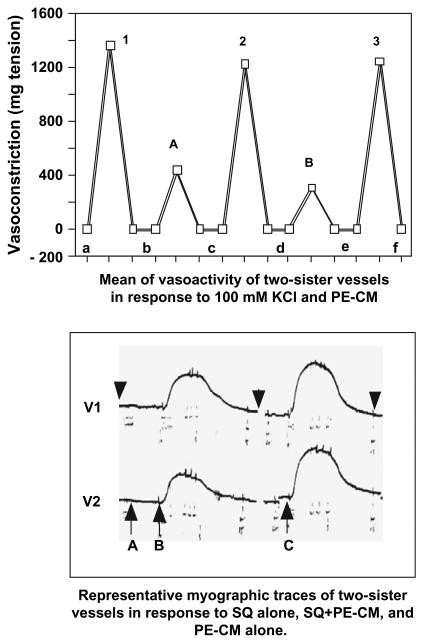
Fig. 1.
Upper Panel: Representative vasomotor responses of two sister vessels from a normal placenta during the duration of a 6 h organ bath perfusion experiment in response to 100 mmol KCl and PE-CM stimulation. Data is expressed in milligram tension. This data illustrate that over a 6 h period, the vessels are still healthy and responsive to stimulation. 1–3: maximum contraction induced by 100 mmol KCl; A and B: maximum contraction induced by PE-CM; and a–f: baseline tension of vessels before, between and after 100 mmol KCl and PE-CM stimulation. Lower Panel: Myographic traces of two sister vessels from the same placenta: V1 and V2. A: SQ29548 alone for 15 min; B: SQ29548 + PE-CM; and C: PE-CM alone. Arrowheads: wash period before, between, and after each perfusion with inhibitor or PE-CM, respectively.

