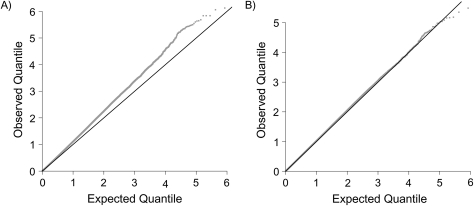
Figure 1.
Q-Q plots for tests of association between disease status and each of 845,814 rs4322256 single nucleotide polymorphism genotypes, before (left panel) and after (right panel) adjustment for confounding, GAIN study of schizophrenia in African Americans, 2006–2008. In each panel, the observed and expected quantiles of the log10 P value for the marginal association tests are represented by gray dots. On the black line, observed and expected quantiles are equal. (GAIN, Genetic Association Information Network).

