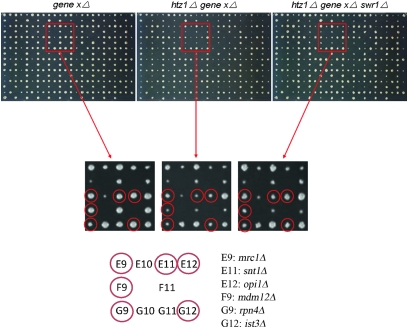
Figure 6.—
SGA miniarray analysis. Three final ordered arrays from one set of the suppressor SGA experiments are shown. Crosses incorporating swr1Δ are used in this example, but similar assays were carried out for all of the suppressors tested. After colony sizes were first normalized across the plates using a set of control strains, synthetic negative gene interactions were scored by comparing plate A to plate B (materials and methods). Bypass suppression was then scored as an increase in colony size of at least 33% comparing plate C to plate B. Reductions or increases in colony sizes can be visualized for the selected deletions showing interactions with htz1Δ. The enlarged areas show examples of suppression with the genes and their locations in the miniarray indicated. Note that snt1 (E11) is one of the core subunits of the Set3 HDAC complex.

