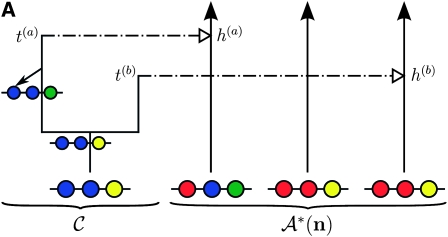
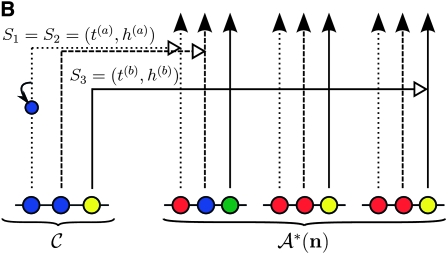
Figure 1.—
Illustration of the corresponding genealogical and sequential interpretations for a realization of  . The three loci of each haplotype are each represented by a solid circle, with the color indicating the allelic type at that locus. The trunk genealogy 𝒜*(n) and conditional genealogy C are indicated. Time is represented vertically, with the present (time 0) at the bottom of the illustration. (A) The genealogical interpretation: Mutation events, along with the locus and resulting haplotype, are indicated by small arrows. Recombination events, and the resulting haplotype, are indicated by branching events in C. Absorption events, and the corresponding absorption time [t(a) and t(b)] and haplotype [h(a) and h(b), respectively], are indicated by dotted-dashed horizontal lines. (B) The corresponding sequential interpretation: The marginal genealogies at the first, second, and third locus (S1, S2, and S3) are emphasized as dotted, dashed, and solid lines, respectively. Mutation events at each locus, along with resulting allele, are indicated by small arrows. Absorption events at each locus are indicated by horizontal lines.


