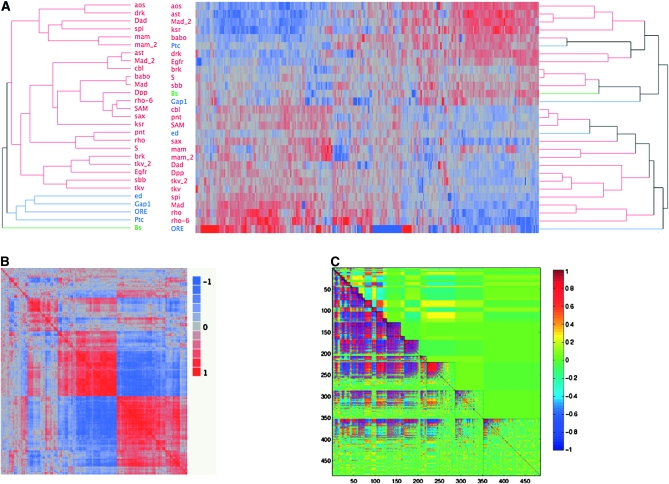
Figure 5.—
Clustering of mutants on the basis of shape or gene expression. Strong covariation within gene expression is shown, despite little similarity in clustering between expression and wing shape. (A) Topologies for dendograms for shape (left) and expression (right) do not correspond. Multiple agglomeration rules and algorithms were utilized, which, varying in specific topology, always demonstrated the lack of correspondence between shape and transcript abundance. Colors (red, blue, and green) represent the clusters observed for the shape variables, which differ from those of the gene expression data. (B) Correlations between transcripts among the mutant lines show considerable amounts of covariation in gene expression in the wing imaginal disc. The symmetric matrix of probe-by-probe correlations for each of the 540 significant probes is shown. Red represents a correlation at or near 1, while blue represents the degree of negative correlation. As is observed, there are large blocks of positively and negatively correlated genes among the mutants. (C) Modularity in gene expression profiles as determined by MMC suggests covariation within and between estimated modules. The diagonal region, enclosed in solid lines, represents the estimated modules, on the basis of the average correlation within modules. Those with the greatest average correlations within modules are at the top, with decreased average correlations moving down the diagonal. The lower off-diagonal represents average cross-module correlations, while above the diagonal represents the correlation for individual transcripts (as in B, but arranged differently). Colors: red, correlation of 1; blue, −1; and green, 0.

