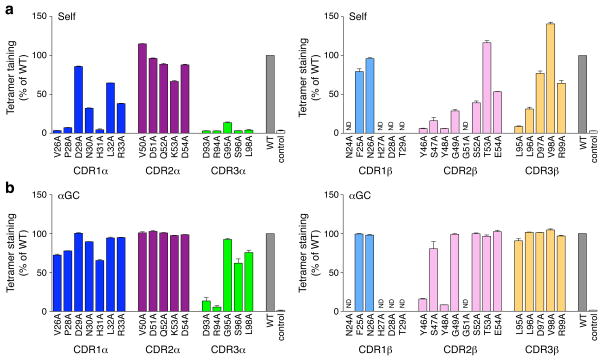
Figure 4.
Mutational analysis of the 2A3-D NKT TCR. Staining of hybridomas expressing mutant versions (horizontal axes) of the Vα14i-2A3-Dβ TCRα (left) or TCRβ (right) with mouse CD1d tetramers loaded with naturally expressed self-antigens(s) (a) or αGC (b). Dark blue, CDR1α, magenta, CDR2α, green, CDR3α, light blue, CDR1β, light pink, CDR2β, yellow, CDR3β. WT, unsubstituted Vα14i-2A3-Dβ TCR (wild-type controls); control, Vα14i-Vβ6-DOβ TCR. ND, not done. The MFI of tetramer staining for each mutant was determined for a narrow TCR gate and is normalized to wild-type MFI (set as 100%). Data represent the mean normalized MFI + s.e.m. of at least two independent experiments.

