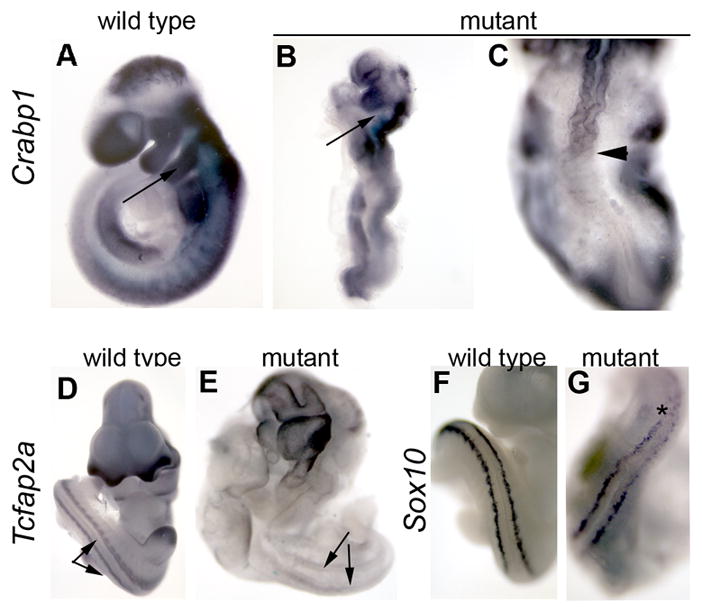
Figure 4. Neural crest cell development in Pax3-Cre;Bmpr1a mutants.

Whole mount in situ hybridization for expression of Crabp1 (A–C), Tcfap2a (D,E), and Sox10 (F,G) in wildtype (A,D,F) and Pax3-Cre;Bmpr1a mutants (B,C,E,G). Arrows in A,B indicate the second pharyngeal arch, which is devoid of NCCs in mutants. (C) Dorsal view of the posterior of same embryo shown in B. Arrow head shows caudal extent of Crabp1 expression. (D,E) Paired arrows indicate columns of NCC derivatives along the spinal cord. Note their deficiency in the mutant, as reflected by lack of Tcfap2a expression. (F,G) Dorsal view of E10.5 embryo just posterior to the forelimb bud. Note reduction of posterior Sox10 expression in mutant in the area indicated by the asterisk.
