
Figure 2.
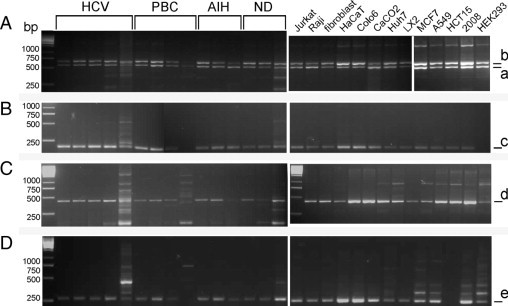
DDR1 isoforms in human liver and cell lines. A:, The two bands at 568 bp (a) and 680/698 bp (b) represent DDR1a and DDR1b/c, respectively. B:, The 125-bp band (c) of isoform c was detected in all samples except one liver with PBC and the HEK293 cell line. C:, The 433-bp band (d) represents DDR1d. D:, DDR1e amplicon of 176 bp (e) was detected in all samples except one PBC sample and the HCT15 cell line. HCV: lanes 1 to 5 represent patients 8, 10, 11, 7, and 9, respectively. PBC: lanes 6 to 9 represent patients 18, 17, 20, and 21, respectively. AIH: lanes 10 to 12 represent patients 4, 5, and 6, respectively. Nondiseased liver samples in lanes 13 to 15 represent nondiseased 5, nondiseased 1, and nondiseased 4.