
Figure 1.
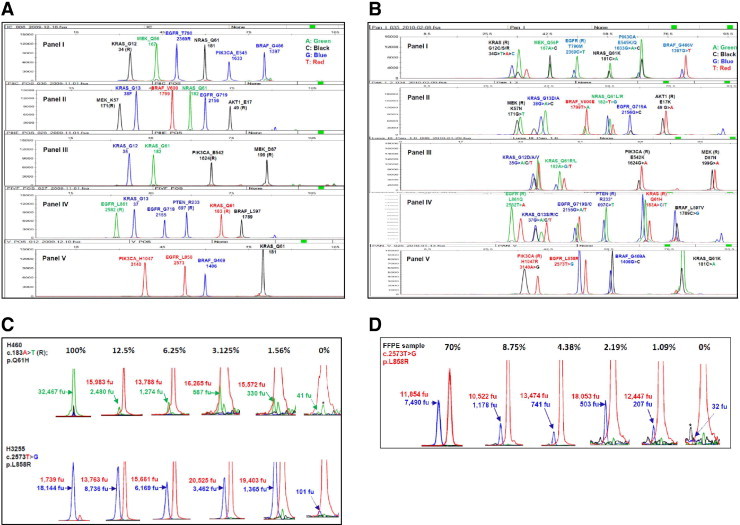
Lung cancer SNaPShot screen (v1.0). A: Human genomic DNA was used as a wild-type control for the multiplex SNaPShot screen, which consists of five panels. Each peak represents a locus where a driver mutation may occur. The name of each gene and the name and position of the amino acid are labeled on the top of each peak. The number under the gene name is the nucleotide position. R designates use of an extension primer encoding the reverse (complementary) strand. B: Pan-positive controls for the SNaPshot screen. Spiking primers were used to display all positive peaks in each locus. C: Sensitivity measurement with cell lines. DNAs from cell lines carrying the known mutations were diluted with human genomic DNA in ratios of 100%, 25% (data not shown), 12.5%, 6.25%, 3.125%, 1.56%, and 0% (wild-type control). Mixtures were then used to perform the SNaPShot screen. Numbers indicate the arbitrary fluorescence units (fu) of wild-type (above) and mutant (underneath) peaks separately. Solid arrows show mutant peaks; and dotted arrows, background peaks. The y axis was adjusted to the appropriate scale to visualize various peaks. Based on previously established criteria,12 the following rules were used to call a mutation: i) A mutation is called confidently if the mutant peak height is 10% or greater of the corresponding wild-type peak [eg, 12.5% dilution of the H460 cell line, as follows: (2480/15,983)×100 = 15.5%]. ii) If the potential mutant peak is less than 10%, the cutoff value [eg, 1.56% dilution of the H460 cell line, as follows: (330/15,572)×100 = 2.1%], a background peak of the same color and size (dotted arrow) in a separate wild-type DNA control (0%) is used as a reference. If the potential mutant peak height is three times or more than the background peak (330/41 = 8.0, >3), a mutation is called positive (see text for further details). *A background peak of the same color but not the same size as a mutant peak. D: Sensitivity measurements with FFPE-derived DNAs. The FFPE-derived DNA from a patient sample containing approximately 70% tumor cells was diluted with FFPE-derived DNA from a patient's normal tissue [ie, 1:1, 1:2, 1:4, 1:8, 1:16, 1:32, and 1:64 corresponded to samples with 70% tumor cells, 35% (data not shown), 17.5% (data not shown), 8.75%, 4.38%, 2.19%, and 1.09%, respectively]; 0% tumor cells (with 100% normal cells) were also analyzed. Numbers indicate the arbitrary fluorescence units (fu) of wild-type (above) and mutant (underneath) peaks separately. Solid arrows show mutant peaks; and dotted arrow, the background peak. The y axis was adjusted to the appropriate scale to visualize various peaks. Asterisks mark background peaks of the same size but not the same color as a mutant peak.