
Figure 3.
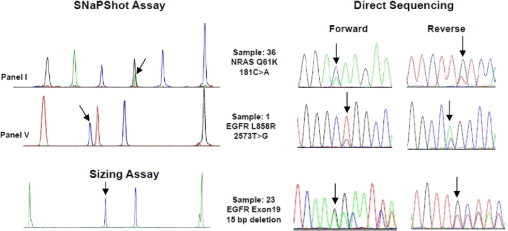
The SNaPshot and sizing assays results confirmed by forward and reverse direct sequencing. Arrows show the positions of mutations. The y axis of the SNaPshot assay involves arbitrary fluorescence units and was adjusted to an appropriate scale for observation of mutant peaks in each panel. Only representative examples are shown; remaining data are not shown.