
Figure 2.
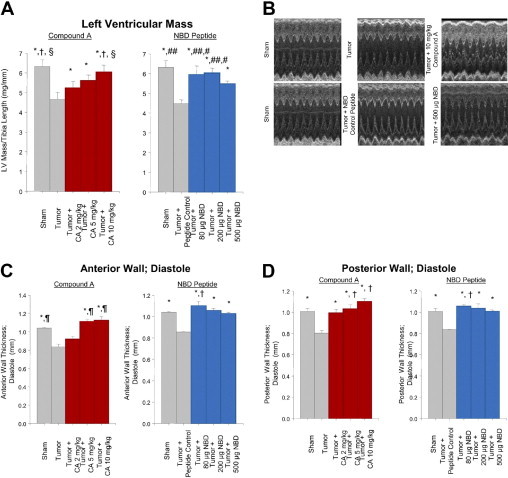
Tumor-induced cardiac atrophy is inhibited using therapeutics inhibiting NF-κB signaling by targeting IκB. A: Conscious echocardiographic analysis of left ventricular mass normalized to tibia length. LV mass (index) = [1.055 * ((ExLVD;d)3 − (LVEDD;d)3); where ExLVD = external left ventricle dimension and LVEDD = left ventricle end-diastolic dimension. *P < 0.01 versus Tumor or Tumor + NBD Control; †P < 0.02 versus Tumor + Compound A 2 mg/kg; §P < 0.05 versus Tumor + Compound A 5 mg/kg; #P < 0.05 versus Sham; and ##P < 0.02 versus Tumor NBD Peptide 500 μg. B: Representative M-mode echocardiographic tracings. C: Anterior wall thickness. *P < 0.01 versus Tumor or Tumor + Mutant NBD Control; ¶P < 0.05 versus Tumor + 2 mg/kg Compound A; and †P < 0.05 versus all other groups. D: Posterior wall thickness of the heart in vivo. *P < 0.01 versus Tumor or Tumor + Mutant NBD Control; and †P < 0.05 versus all other groups.