
Figure 4.
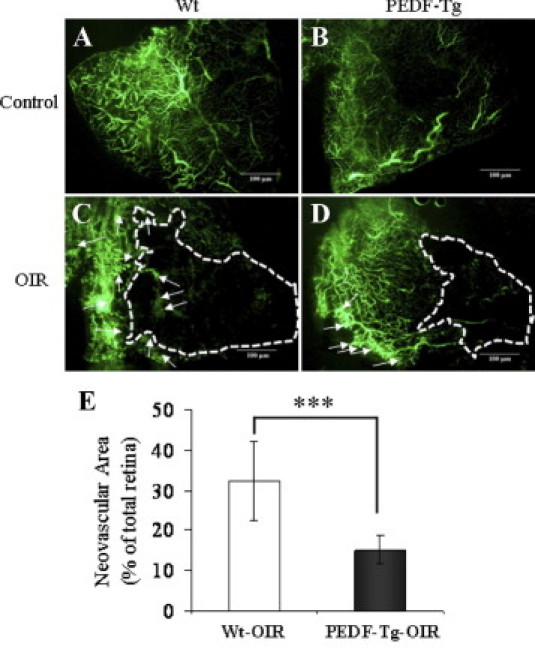
The inhibitory effect of PEDF overexpression on retinal neovascularization in the OIR model. PEDF-Tg and Wt mice were exposed to 75% oxygen from postnatal day 7 to 12. The Wt and PEDF-Tg mice with OIR were perfused with fluorescein-dextran at postnatal day 18 and the retina flat mounted. A–D: Representative retinal angiographs from the eyes of Wt and PEDF-Tg mice with OIR (C and D) and Wt and PEDF-Tg mice in the room air (A and B) as a control. C and D: The white arrows indicate neovascular tufts in the peripheral retina. The white dotted line represents avascular area in the central retina. All of the images were from the peripheral retina (no optic nerve included). E: Quantification of the neovascularization in the retinas from Wt and PEDF-Tg mice with OIR. Retinal neovascularization was semiquantified by measuring the ratio of the neovascular tuft area to the total retinal area using the advanced SPOT software (mean ± SD, n = 8, ***P < 0.001).