
Figure 5.
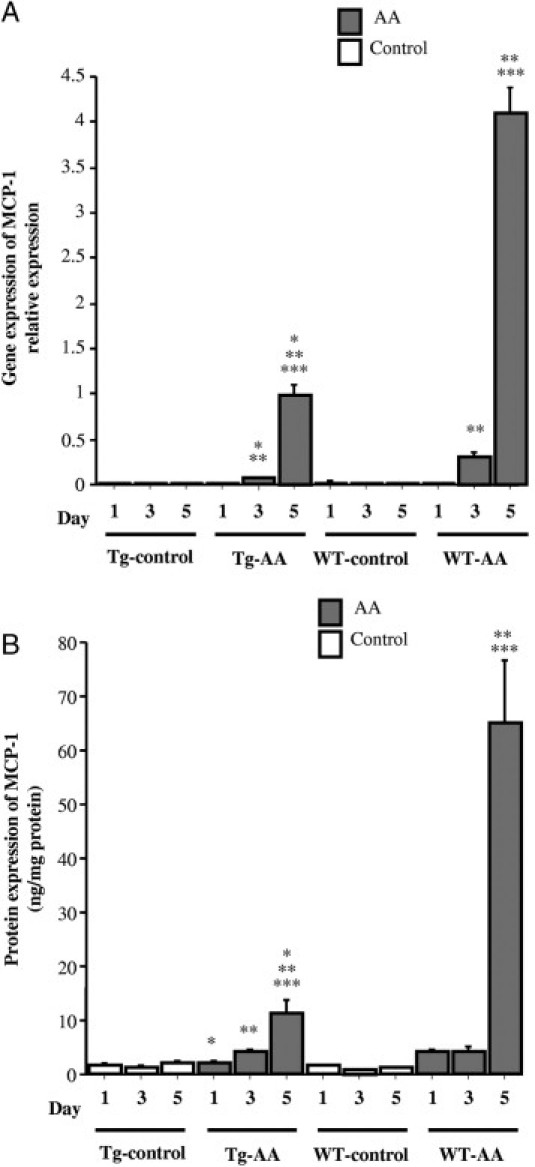
Expression of MCP-1 in the kidney of Tg and WT control and AA-treated mice. A: Expression of MCP-1 mRNA transcripts was determined by TaqMan real-time PCR, normalized to that of GAPDH mRNA transcripts in the same sample. B: The expression of MCP-1 protein was determined by ELISA and corrected for the total amount of protein. Data are reported as means ± SE. *P < 0.05, compared with the WT group on the same day; **P < 0.05, compared with the same group on day 1; ***P < 0.05, compared with the same group on day 3.