
Figure 3.
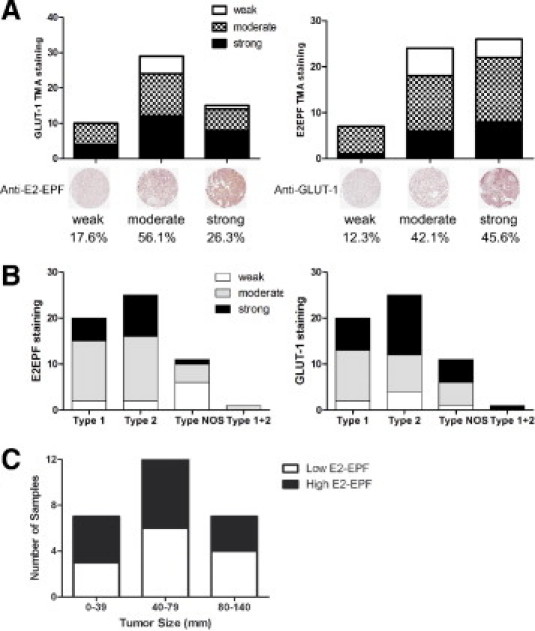
E2-EPF expression is associated with GLUT-1 expression. A: Tissue microarrays (TMAs) consisting of 57 PRCC samples in quadruplicate were immunostained with anti-E2-EPF (right) and anti-GLUT-1 (left) antibodies and scored blind by two independent observers. Tumor cores meeting the quality standard criteria (see Materials and Methods) were considered for analysis. Representative papillary renal cell carcinoma (PRCC) cores stained with anti-E2-EPF and anti-GLUT-1 antibodies showing the different staining intensities (weak, moderate, and strong) are shown below the graphs. B: Intensities in GLUT-1 (right) and E2EPF (left) expression were analyzed in type 1, type 2, and type not otherwise specified (NOS: type 1 or 2), and mixed type 1 + 2 PRCC groups. C: E2-EPF protein expression levels in 27 patient samples with available clinical follow-up information (see Table 1) as determined via TMA immunohistochemisty and/or Western blot analysis were plotted against tumor size.