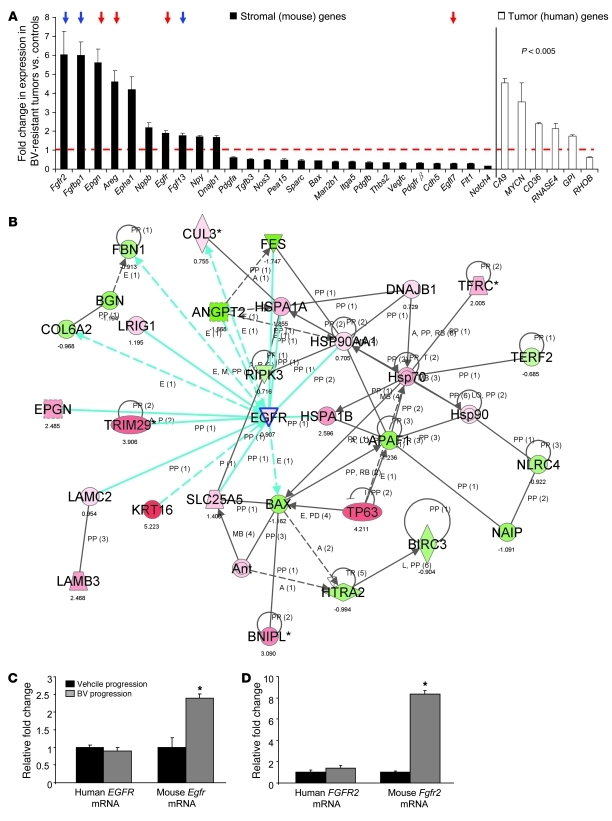
Figure 2. BV resistance is associated with increased expression of stromal genes involved in angiogenesis.
(A) Stromal and human angiogenic genes were differentially regulated in H1975 BV-resistant xenografts compared with vehicle controls (n = 3 per group). P < 0.005, 2-sample t test with random variance model. Exact permutation P values for significant genes were computed based on 10 available permutations. Data represent differences in fold change of genes in BV-resistant tumors versus controls. The dashed red line indicates fold change 1 (i.e., no change versus controls). Red and blue arrows indicate Egfr and Fgfr family member genes, respectively. (B) Functional pathway analysis of selected genes and their interaction nodes in a gene network significantly modulated between the BV-resistant and control xenograft mouse stroma. Network score was calculated by the inverse log of the P value and indicates the likelihood of focus genes in a network being found together not by chance. The selected genes (Egfr, Bax, and Dnajb1) and their interaction segments are highlighted by a blue border. Gene expression variation by at least 1.5-fold is indicated by color (red, upregulated; green, downregulated; gray, NS). (C and D) qRT-PCR showing human EGFR and mouse Egfr (C) and human FGFR2 and mouse Fgfr2 (D) mRNA expression in H1975 xenografts that progressed on vehicle and BV treatments (n = 4 per group). Data are normalized relative to vehicle progression samples and shown as relative fold change. *P < 0.05, t test.

