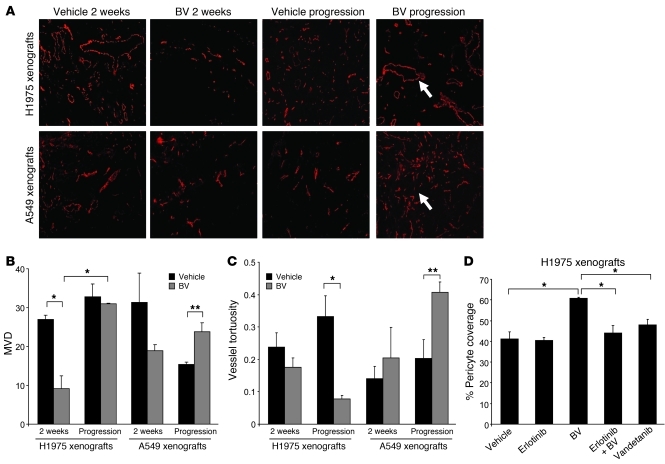
Figure 5. Altered patterns of tumor vascular density, tortuosity, and pericyte coverage in BV-resistant xenograft tumors.
(A) Microphotographs of CD31+ tumor vessels (red) in H1975 and A549 xenografts treated with vehicle and BV after 2 weeks and at progression. 5–10 microscopic fields were collected from each of 4 specimens per group. Arrows indicate the different vessel morphology in H1975 (top panel) and A549 (lower panel) BV-resistant tumors. Original magnification, ×100. (B and C) Quantification of MVD (B) and vessel tortuosity (C) based on CD31-stained tumor sections in H1975 and A549 xenografts treated with vehicle and BV after 2 weeks and at progression. 5 hotspot microscopic fields (×200) per tumor section were analyzed to quantify MVD; 5 random microscopic fields (×100) were quantified for vessel tortuosity analysis. n = 4 per group. Units of the y axis for MVD (B) represent CD31 + vessels per HPF (high power field). The y axis for vessel tortuosity (C) represents the ratio T = (L/S) – 1. (D) Pericyte coverage of H1975 xenografts was quantified as percent CD31+ vessels with at least 50% coverage of associated desmin+ cells in at least 5 microscopic fields (×200) in tumors receiving long-term treatment. n = 2 (vandetanib); 3 (erlotinib); 4 (vehicle, BV, and erlotinib+BV). (B–D) *P < 0.01, **P < 0.05, t test.

