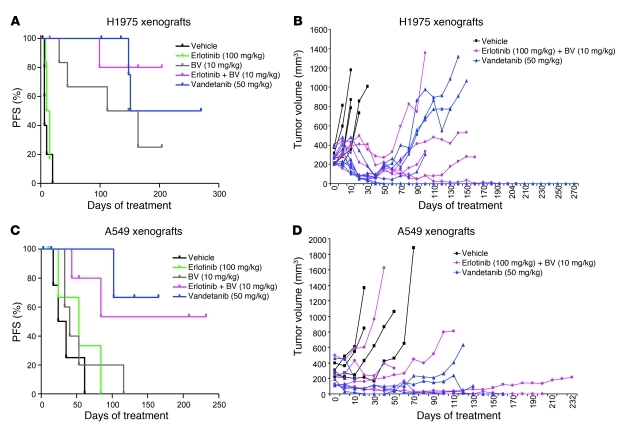
Figure 6. Effect of dual EGFR/VEGFR2 inhibition on H1975 and A549 NSCLC xenograft models.
(A and C) Distribution of PFS, shown by Kaplan-Meier plots, and (B and D) individual tumor growth curves of H1975 (A and B) and A549 (C and D) xenografts receiving long-term treatment as indicated. Log-rank test was used to compare statistical differences in survival among treatment groups.

