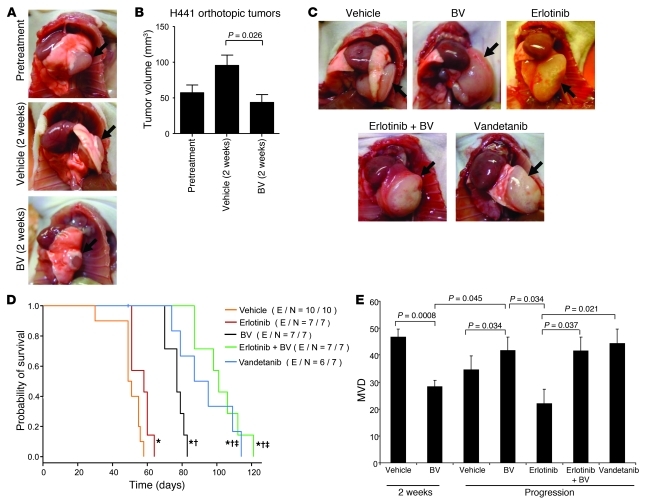
Figure 7. Orthotopic H441 NSCLC tumor growth and MVD after VEGF blockade or dual EGFR/VEGFR pathway inhibition.
(A and B) Representative photographs (A) and mean tumor volume obtained at the last measurement (B) of H441 orthotopic tumors before or after 2 weeks of treatment. Arrows denote tumor mass in the lung. n = 8 (pretreatment); 9 (vehicle); 10 (BV). P value was calculated using Mann-Whitney test. (C) Representative photographs of H441 orthotopic tumors after long-term administration. n = 10 (vehicle); 7 (erlotinib, BV, and erlotinib+BV); 6 (vandetanib). Arrows denote tumor mass in the lung. (D) Kaplan-Meier plots showing survival distribution in H441 orthotopic tumor–bearing mice treated as indicated. Number of events (E) per number in each group (N) is indicated. *P < 0.05 versus vehicle, †P < 0.01 versus erlotinib, ‡P < 0.05 versus BV, log-rank test. (E) MVD quantification in H441 orthotopic tumors. n = 4 (erlotinib); 5 (vehicle 2 weeks and vandetanib); 6 (BV 2 weeks and vehicle progression); 7 (BV progression and erlotinib+BV). Statistical values were calculated using t test. Units in the y axis for MVD represent CD31 + vessels per HPF.

