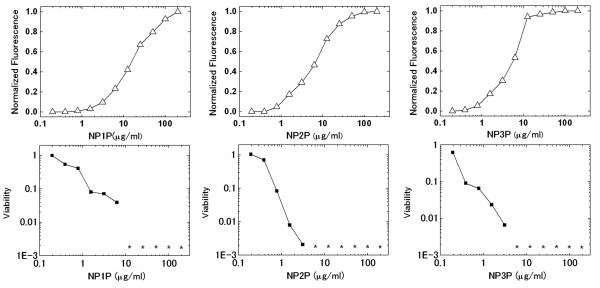
Figure 3.
Dose-membrane disruption and -bactericidal effect curve of NP1P-NP3P against S. aureus IFO12732. These curves were simultaneously determined. The asterisks indicate that viable cells were not detected. Disruption of the cytoplasmic membrane was estimated by the increase in fluorescence intensity of diS-C3-(5). Changes in fluorescence were normalized by the value at the plateau of the dose-response curves.

