
Figure 4.
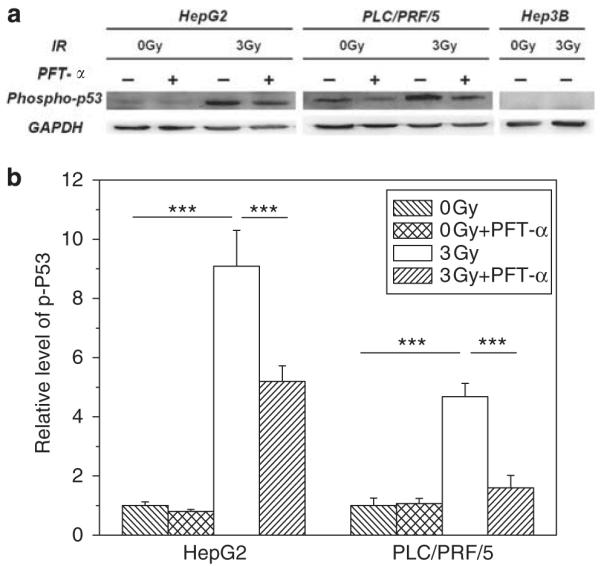
Western blot analysis of the expression of phospho-p53 (Ser15) and GAPDH in human hepatoma cells 12 h after 3 Gy γ-irradiation. In some experiments, HepG2 and PLC/PRF/5 cells were treated with 20 μm PFT-α 20 h before irradiation and during the subsequent cell culture period. (a) Immunoblots of phospho-p53 and GAPDH of the hepatoma cells under different conditions. (b) Relative level of phospho-p53 expression in the hepatoma cells. Values were normalized to GAPDH level in each sample, and then the ratio of each normalized value to its corresponding control (0 Gy) was calculated. ***P<0.001 compared with the control or PFT-α treated cells. All data were presented as the mean±s.e. for three experiments.