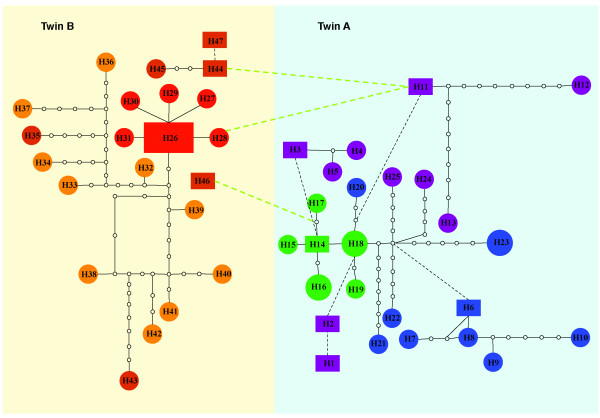
Figure 2.
Statistical parsimony network of rt in each twin. The network is constructed so that the colored squares and circles represent actual cloned sequences. The size of the colored squares and circles is proportional to the number of sequences displaying the same genotype. Each open circle represents putative sequences in the evolutionary pathway. The solid lines on a network represent mutational connections among unique genotypes with at least a 95% degree of confidence, whereas the dashed lines represent a more tenuous connection. Different colors in the network were used to represent three sampled time points in the rt sequences for twin A and twin B (green: 09/15/1998, blue: 10/13/1998 and purple: 11/10/1998).

