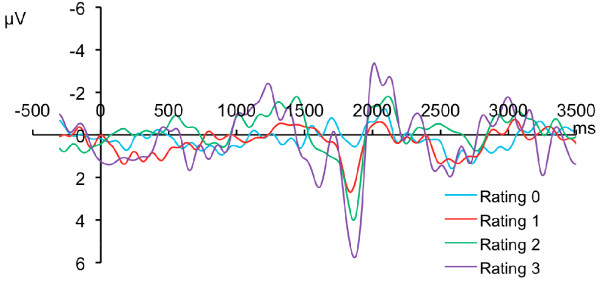
Figure 2.
Cortical Evoked Potential Evoked by 1.5 s Low Intensity Diode Infrared Laser Pulses. Each trace represents grand average of EEG response of 10 subjects subjected to 15 pulses of each of 4 intensities (3 painful intensities, 1 sub pain threshold). Traces are aligned with the start of the pulses and show small earlier (first) negative (up) phase and positive (down) phases followed by another (second) negative phase. The amplitude of the positive and second negative waves were directly correlated to the numeric pain rating evoked for that stimulus.

