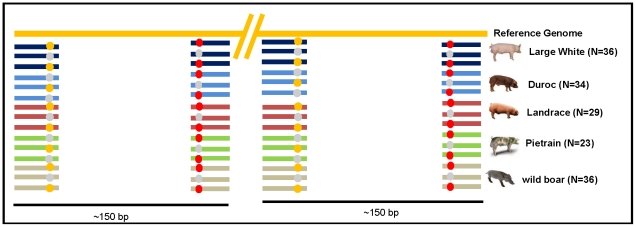
Figure 1. Schematic drawing showing the expected alignment between reads and the reference genome.
The colored bars represent the reads; each color corresponds to a different pig population. The reads originated from ∼150 bp fragments of RRL libraries of pooled DNA for each pig population. Therefore, for each read the identification is only available at the population level. Colored dots on the reads represent SNP positions.

