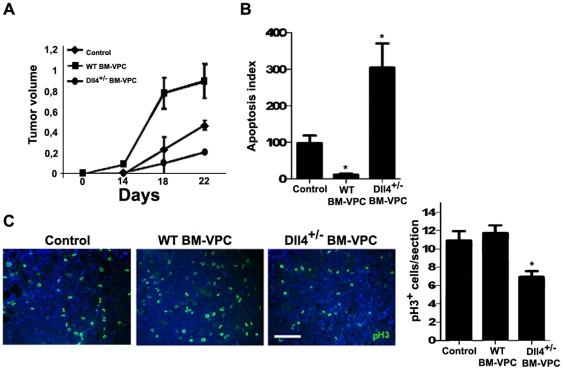
Figure 5. Dll4+/−BM-VPC tumors have a smaller growth rate than WT BM-VPC tumors, and increased apoptosis.
A. Tumor volume ((LxW2)/2) in control, WT BM-VPC and Dll4+/− BM-VPC-Dll4 tumors. B. As determined by TUNEL staining, tumor apoptosis index 15 days after inoculation, in control, WT BM-VPC and Dll4+/− BM-VPC tumors. C. Tumor proliferation index (number of phosphor-histone 3 (pH3) per section) pH 3 staining in tumor cryosections. These quantifications were done in triplicate, in tumor sections obtained from 2 independent experiments. Scale bar indicates 150 µm. (values show the mean plus s.e.m. *: P<0.05).

