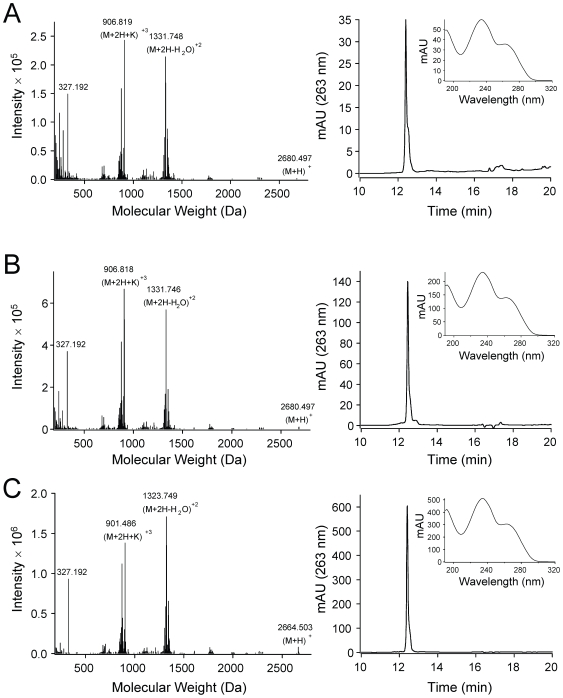
Figure 3. Toxin analysis of zoanthid samples collected from aquarium stores.
High resolution mass spectrometric (left column) and high performance liquid chromatographic (right column) analysis of [A] palytoxin standard, from P. tuberculosa, purchased from Wako Pure Chemicals, Tokyo, Japan, [B] sample 305.11.2 (Figure 2C), purchased from aquarium store #1, which contained approx. 500 µg palytoxin/g wet zoanthid and [C] sample 306.37.3 (Figure 2D), purchased from aquarium store #2, which contained approx. 3500 µg deoxy-palytoxin/g wet zoanthid. For all 3, the inset graph in the right column is the UV spectra for the HPLC peak at 12.4 minutes. All samples contained a 327 Da. fragment and UV maxima at 233 and 263 nm, which are characteristic of palytoxins.

