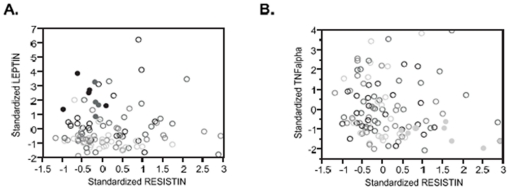
Figure 3. Clustering of Phenotypes in Families.
Several families in the replication cohort were observed where each of the parents and their children were in the upper or lower quartile for age-adjusted BMI, as well as for two or more adipocytokine measures. Shading of each circle corresponds to age-adjusted BMI (low BMI, light; high BMI dark), and the filled circles represent members of two families in each plot. (A) All members of families 124 and 128 were obese and had high leptin coupled with low resistin concentrations. (B) All members of families 157 and 160 had low TNFα but high resistin concentrations and were in the lowest third of age-adjusted BMI.

