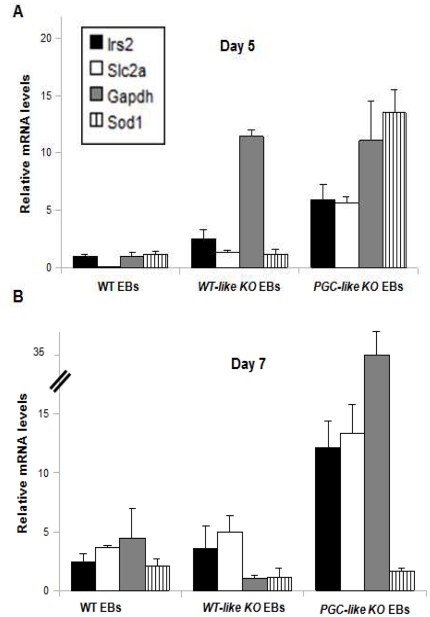
Figure 5. Metabolic transcription behaviour of the WT and Prnp-null cell lines.
WT, WT-like KO EB and PGC-like KO EB mRNA expression patterns for Irs2 (Insulin Receptor Substrate 2), Slc2a (Glucose Transporter 1 - Glut1 -), Gapdh (Glyceraldehyde 3-phosphate Dehydrogenase) and Sod1 (Superoxide Dismutase 1) on Days 5 (A) and 7 (B). (Error bars, s.e.m.).

