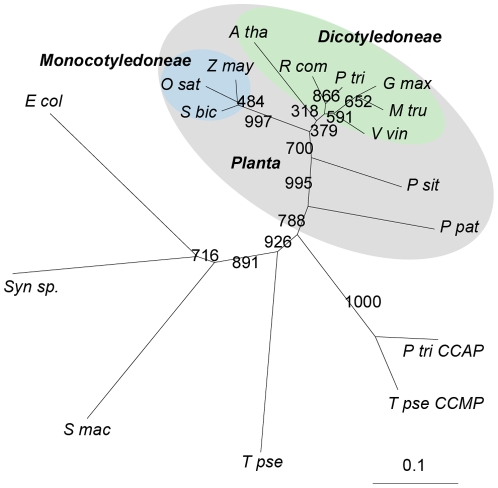
Figure 2. Unrooted tree depicting phylogenetic relationships for catalytic domains of cyanases.
The tree was constructed using the neighbour-joining method. Bootstrap values were calculated on 1,000 repeats of the initial alignment using a seed value of 111. The length of lines connecting the proteins indicates the mean number of estimated substitutions per site. And the scale bar represents 0.1 substitution per site. Accession numbers for each cyanase are listed in Table 1. Cyanases from plants are highlighted in grey, cyanases from Dicotyledoneae are highlighted in green and cyanases from Monocotyledoneae are highlighted in blue.

