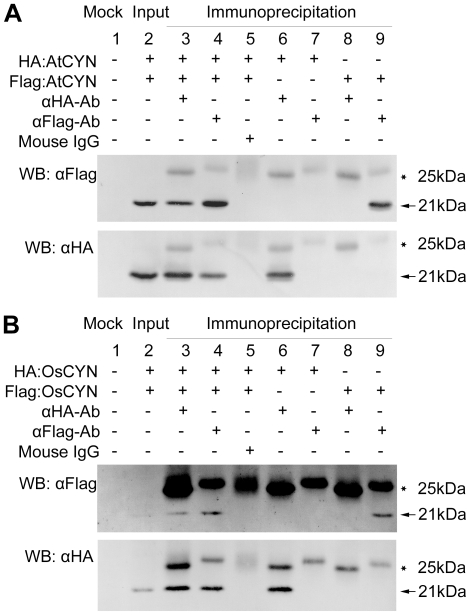
Figure 7. Coimmunoprecipitation assay demonstrating self-interaction of AtCYN (A) and OsCYN (B).
Although an extremely low amount of OsCYN proteins was detected in the input samples, an identical pattern was shown by OsCYN in the assay. Lane 1: Mock; Lane 2: HA:CYN and FLAG:CYN were detected in the input samples; Lane 3: when anti-HA antibody was added, FLAG:CYN immunoprecipitated with HA:CYN (Lanes 6&8 were controls); Lane 4: when anti-FLAG antibody was added, HA:CYN immunoprecipitated with FLAG:CYN (Lanes 7&9 were controls); Lane 5: Native mouse IgG was used as negative control of antibodies. Bands of HA:CYN and Flag:CYN are indicated with arrows and bands of mouse IgG are indicated with stars.

