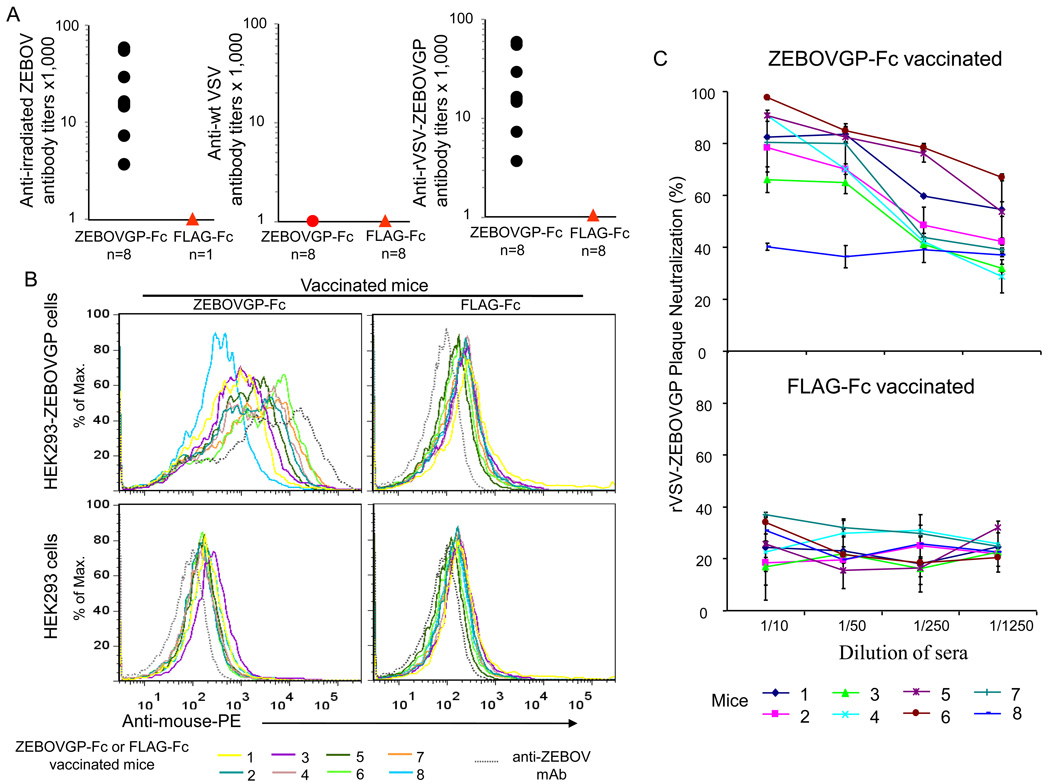
Fig. 4.
Humoral immune response in C57BL/6 mice vaccinated with ZEBOVGP-Fc. A) Analysis of anti-ZEBOV GP specific antibodies by viral particle ELISA. C57BL/6 mice (n=8) were vaccinated with ZEBOVGP-Fc or FLAG-Fc and sera samples were obtained 2 weeks after the final vaccination. Sera were titrated on 96-well plates coated with rVSV-ZEBOVGP, control wt VSV, or sucrose-purified irradiated ZEBOV particles. The endpoint dilution titer for each mouse sera is represented as a black dot. The anti-wt VSV titers of sera from the ZEBOVGP-Fc vaccinated mice were bellow the detection limit and are represented as a read dot. The titers of the sera from FLAG-Fc immunized mice were also bellow the detection limit and are represented as read triangles. B) Flow cytometry analysis of binding of the mouse sera to ZEBOV GP expressed at the cell surface of HEK293-ZEBOVGP cells. HEK293-ZEBOVGP or control vector-transfected HEK293 cells were stained with mouse sera (1 µl) and PE-conjugated goat anti-mouse IgG Ab and analyzed by flow cytometry. The histogram of each mouse sera is shown in a different color, and the histogram of the positive control anti-GP mAb 13F6-1-2 is shown as a dashed grey line. To simplify the graph, the same color was used for sera from two different mice, one vaccinated with ZEBOVGP-Fc (left panels) and the other with FLAG-Fc (right panels). C) Neutralization of rVSV-ZEBOVGP with sera from ZEBOVGP-Fc vaccinated mice. A plaque reduction assay was performed in Vero E6 cells using 100 pfu of rVSV-ZEBOVGP treated with five-fold dilutions of sera from mice vaccinated with ZEBOVGP-Fc or FLAG-Fc. Percent neutralization of each mouse serum was calculated as the reduction in the number of plaques compared to untreated rVSV-ZEBOVGP. Values in the graphs are the mean percent neutralization in duplicate samples for each mouse sera dilution, and bars represent the standard deviations.

