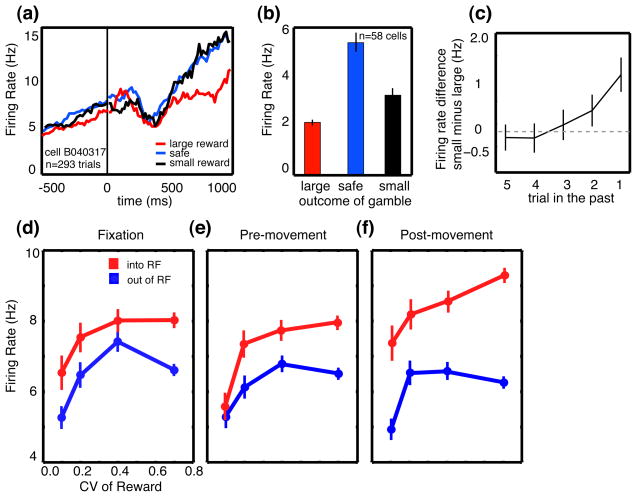
Figure 1.
CGp encodes reward outcomes over multiple trials and predicts changes in strategy. (a) PSTH for example neuron following reward delivery when monkeys choose between variably rewarded outcomes and deterministically rewarded outcomes with the same mean reward rate. Firing rates were significantly greater following small or medium rewards than following large rewards. (b) Bar graph showing the average firing of all neurons in the population following delivery of large, medium, and small rewards. Firing rates are averaged over a 1s epoch beginning at the time of reward offset (t=0). Tick marks indicate one standard error. (c) Average effect of reward outcome on neuronal activity up to five trials in the future. Bars indicate one standard error. (d–f) Average neuronal firing rates as a function of coefficient of variation (CV) in reward size plotted for 3 trial epochs in the probabilistic reward task. Firing increased for saccades into the neuronal response field (RF), and was positively correlated with reward CV (standard deviation/mean). Bars represent s.e.m. Adapted from [38] and [32].

