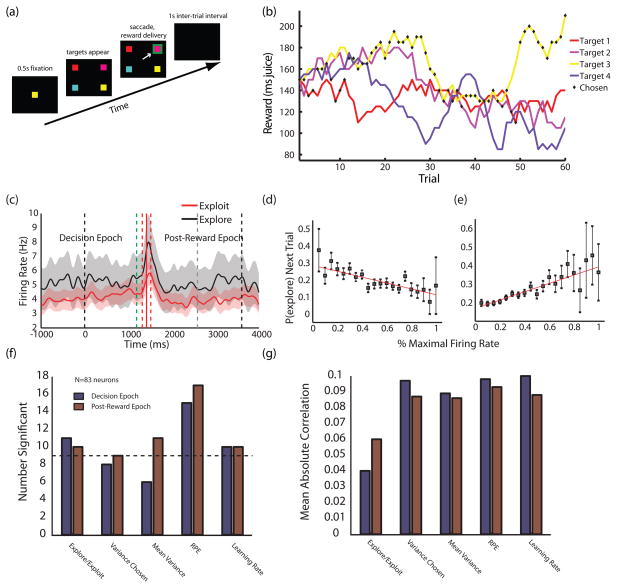
Figure 2.
CGp neurons encode variance/learning rate and change probability in a volatile environment. (a) Schematic of the four-armed bandit task. Four targets appear each trial, each baited with an independently varying juice reward. (b) Sample payouts and choices for the four options over a single block. Reward values for each target independently follow a random walk process. Black diamonds indicate the monkey’s choices during the given block. (c) PSTH for example neuron in the 4-armed bandit task, showing significant differences in firing for exploratory and exploitative strategies in both the decision and evaluation epochs. Exploit trials are in red, explore trials in black. The task begins at time 0. Onset of the “go” cue (dashed green line), reward delivery (solid red line), beginning of intertrial interval (dashed gray line), and end of trial (rightmost dashed black line) are mean times. Dashed red lines indicate ± one standard deviation in reward onset. Shaded areas represent s.e.m. of firing rates. (d,e) Neurons in CGp encode probability of exploring on the next trial. Points are probabilities of exploring next trial as a function of percent maximal firing rate in the decision epoch, averaged separately over negatively- and positively-tuned populations of neurons (d and e, respectively). (f) Numbers of neurons encoding relevant variables in a Kalman filter learning model of behavior [8, 39]. Bars indicate numbers of significant partial correlation coefficients for each variable with mean firing rate in each epoch when controlling for others. The decision epoch (blue) lasted from trial onset to target selection; the post-reward epoch (red) lasted from the end of reward delivery to the end of the inter-trial interval. Dotted line indicates a statistically significant population of neurons, assuming a p=0.05 false positive rate. Variance chosen indicates the estimated variance in the value of the chosen option. Mean variance indicates the mean of this quantity across all options. (g) Mean absolute partial correlation coefficients for significant cells. Colors are as in (f). Adapted from [39].

