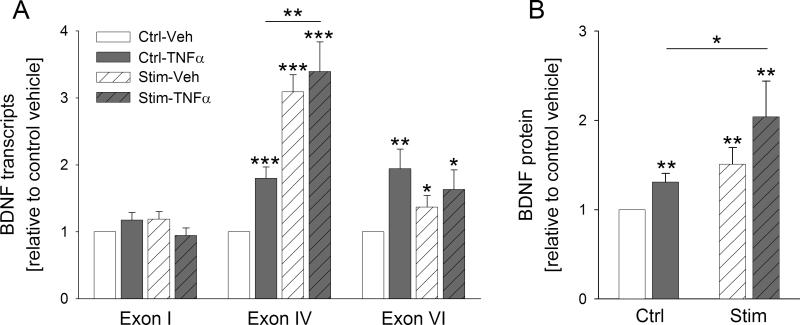
Figure 4. Electrical stimulation of TG neurons results in potentiation of TNFα-induced BDNF protein expression.
A, Levels of three BDNF transcripts (I, IV and VI; relative to unstimulated vehicle; Ctrl-Veh, white solid bar) in response to 4-hr treatment of cultures with 10 ng/ml TNFα (Ctrl-TNFα, grey solid bar), 24-hr electrical field stimulation at 1 Hz followed by 4-hr treatment with vehicle (Stim-Veh, white hatched bar), or 24-hr electrical stimulation followed by 4-hr treatment with 10 ng/ml TNFα (Stim-TNFα, grey hatched bar). Individual transcript levels were calculated using the reference gene HPRT; n=22 experiments. B, BDNF cell content (relative to unstimulated vehicle whose value was made equal to one; Ctrl-Veh, white solid bar) in response to 24-hr treatment with 10 ng/ml TNFα alone (Ctrl-TNFα, grey solid bar), 24-hr electrical field stimulation at 1 Hz followed by 24-hr treatment with vehicle (Stim-Veh, white hatched bar), or 24-hr stimulation followed by 24-hr treatment with 10 ng/ml TNFα (grey hatched bar); n=5 experiments. *p<0.05, **p<0.01, ***p<0.001.

