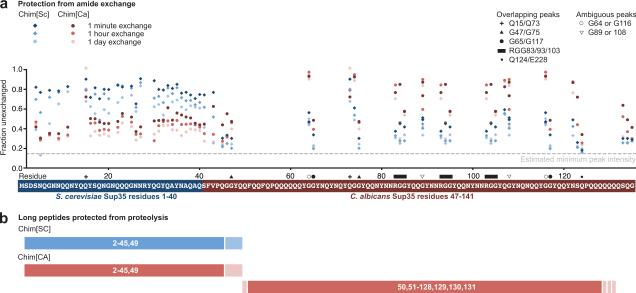
Figure 3.
Dramatically different regions of Chim[SC] and Chim[CA] are protected from amide exchange and proteolysis
(a) Amide exchange data for Chim[SC] and Chim[CA] mapped to residue location. Intensities for all assigned and distinct peaks in the Chimera prion domain are plotted as a fraction of the unexchanged intensity. Estimated minimum peak intensity (dotted line) is calculated based on maximum exchange observed in the middle domain (Fig. S1). For overlapping peaks, values represent the combined intensities. For ambiguous peaks, intensities of both peaks are plotted. (b) Limited proteolysis of Chim[SC] and Chim[CA]. Chimera amyloid fibers (5 μM, 1 ml) in 5 mM potassium phosphate, 150 mM NaCl, pH 7.5 were digested with proteinase K (1.5 μg/ml) at room temperature for 2 hours. After the amyloid solution was ultracentrifuged at 214,000g for 30 min, the supernatant was removed and the pellet was washed with 1 ml of buffer and ultracentrifuged again. The pellet was dissolved in 100 μl DMSO (similar results were found with 6 M guanidine HCl, 25 mM Tris, pH 7.5). For the MALDI-TOF MS measurement, the dissolved peptides were desalted by NuTip C4 (Glygen) and analyzed with Microflex (Bruker Daltonics). As a matrix, we used 3,5-dimethoxy-4-hydroxycinnamic acid. Identification of peptides was performed using the program PAWS (ProteoMetrics). Summary of peptides identified are schematically diagrammed here.

