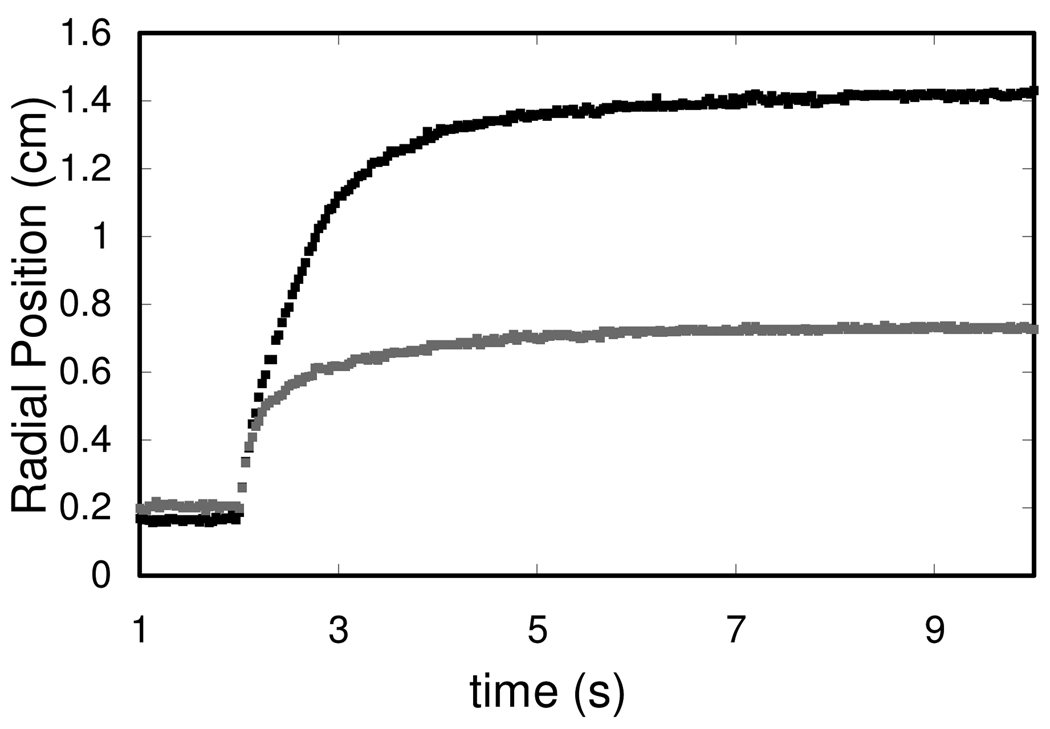
Figure 8.
Position of innermost tracer particle for CTAB solutions of varying concentration on 1 wt% polyacrylamide solution subphase. Curves are labeled by their CTAB concentrations and initial surface tension differences Δγ = γsub − γdrop. black, C = 0.5 mM and Δγ = 23 mN/m; gray, C = 0.1 mM and Δγ = 23 mN/m.

