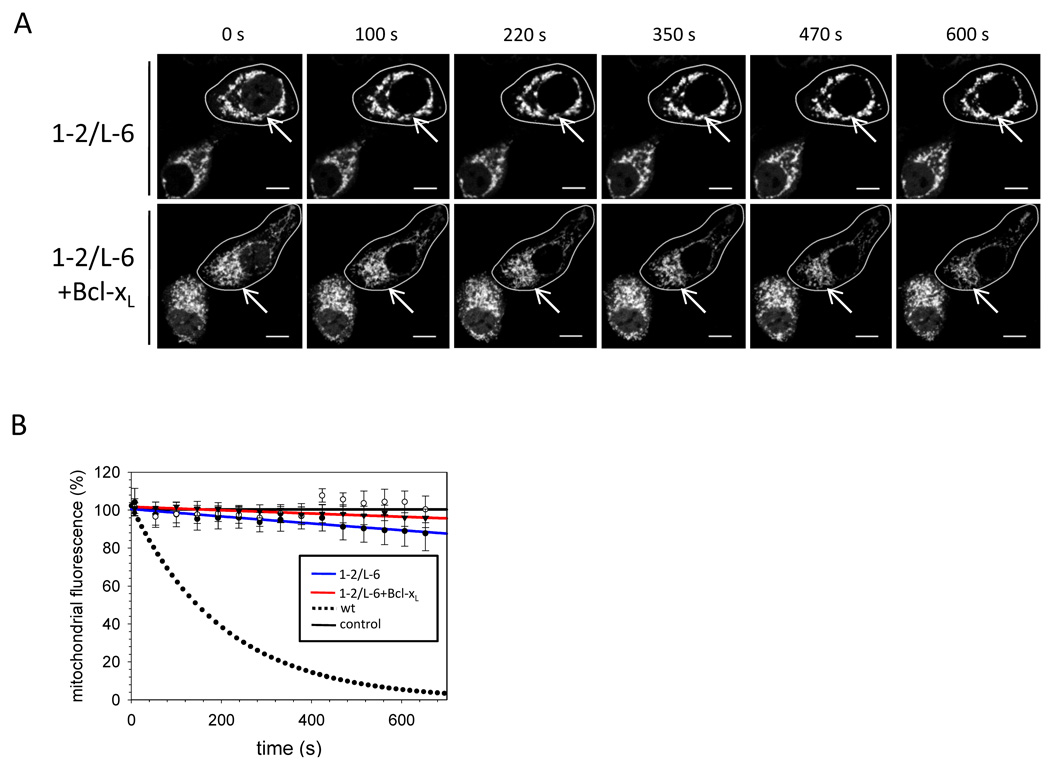
Figure 5. Bax 1–2/L-6 is deficient in retrotranslocation.
(A) Time course recorded for GFP-Bax 1–2/L-6 in the absence (top) and presence (bottom) of over-expressed Bcl-xL in FLIP experiments. FLIP diminishes GFP-Bax 1–2/L-6 in the cytoplasm of a targeted cell (circled) quickly in parallel to wt Bax, but mitochondrial signals (arrows) remain stable. Time points in seconds during FLIP iterations are displayed above the pictures.
(B) FLIP of mitochondrial GFP-Bax 1–2/L-6 as shown in (A) in the absence (blue, ●) and presence (red, ▼) of over-expressed Bcl-xL. The neighboring cell fluorescence (○) and cells transfected with GFP-Bax wt (●●●) serve as controls. Data represent averages ± SEM from 20 (Bax 1–2/L-6 − Bcl-xL) and 18 (Bax 1–2/L-6 + Bcl-xL) ROI measurements.

