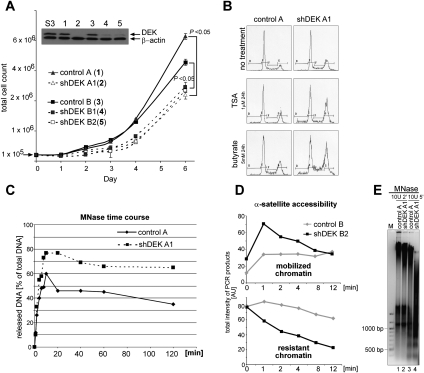
Figure 1.
Interference with DEK expression in cells induces a phenotype indicative of more accessible chromatin organization. (A) Comparative growth curves. Stable DEKkd in HeLa S3 cells was achieved by lentiviral delivery of either one (4,5) or two (2) distinct shRNAs targeting DEK, or no shRNA as control (control A [H1-LV vector; 1] or control B [PLKO.1 vector; 3]) (see also Supplemental Fig. S2). After the appropriate selection procedure (GFP expression [1,2] or puromycin [3–5]), total cell numbers were counted at the indicated time points. Results from three individual experiments were plotted (error bars represent ±SD) and P-values for the indicated pairwise comparisons were obtained by two-tailed Student's t-test. The inset illustrates inhibition of DEK expression as assessed by immunoblotting. (S3) Parental cell line. (B) Cell cycle analysis was performed using FACS for cell lines (as denoted in A), and representative cell cycle profiles without treatment (no treatment) or with treatment with TSA (TSA) or sodium butyrate (butyrate) for 24 h are shown. (C) MNase digestion time course assessing chromatin release. Nuclei from indicated cell lines were subjected to MNase digestion. At the denoted time points, aliquots were taken and released chromatin was separated from digestion refractory chromatin by centrifugation. DNA content of individual samples was assessed fluorimetrically (and by agarose gel electrophoresis) (see Supplemental Fig. S4A). Values displayed represent the ratio of released versus total DNA content at time point 0. Similar results were obtained in three independent experiments. (D) Assessment of α-satellite repeat accessibility. Nuclei from indicated cell lines were processed as described in C. DNA from individual samples was purified and subjected to α-satellite-specific PCR and agarose gel electrophoresis (see Supplemental Fig. S4B–D). Total product intensity in individual lanes, normalized to total intensity at time point 0, was analyzed using ImageJ software, and relative values are displayed in the graphs. (Top panel) Mobilized α-satellite repeats. (Bottom panel) Resistant, not mobilized α-satellite repeats. Similar results were obtained in three independent experiments. (E) MNase digestion of melanoma DEKkd cells. Nuclei were treated with MNase, and reactions were analyzed directly by agarose gel electrophoresis. DNA was visualized by EtBr staining, and one representative experiment out of three is shown. A DNA size marker is shown on the left (M).

