Figure 6.
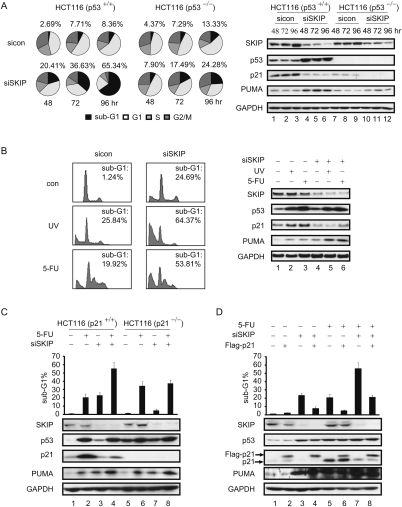
SKIP is required for cell survival and modulates DNA damage-induced cell apoptosis. (A, left panel) FACS analysis of the cell cycle profile. HCT116 cells or HCT116 p53−/− cells were harvested at indicated times after transfection with control or SKIP siRNA, and the DNA content was determined by FACS. Pie charts display the percentage of cells in each stage of the cell cycle. The percentage of sub-G1 cells is indicated above each chart; Supplemental Table S1 lists the data for other cell cycle phases. (Right panel) Cell extracts were subjected to immunoblot analysis. (B, left) FACS analysis of cell apoptosis. Twenty-four hours after control or SKIP siRNA transfection, HCT116 cells were left untreated or treated with UV (60 J/m2) or 5-FU (50 μM) for 24 h. The percentage of cells in the sub-G1 phase was quantified for the plots. (Right panel, lanes 1–6) Cell extracts were subjected to immunoblot analysis. Role of p21 in SKIP-regulated cell apoptosis. (C, top panel) FACS analysis of cell apoptosis. HCT116 cells or HCT116 p21−/− cells were transfected with control or SKIP siRNA for 24 h, and left untreated or treated with 5-FU (50 μM) for 24 h. The percentage of cells in the sub-G1 phase was quantified by FACS and is represented in the graph. (Bottom panel, lanes 1–8) Cell extracts were subjected to immunoblot analysis. (D, top panel) FACS analysis of cell apoptosis. HCT116 cells were first transfected with empty vector or pCMV-Flag-p21, and, 24 h later, were transfected with control or SKIP siRNA for another 24 h, and then the cells were left untreated or treated with 5-FU (50 μM) for a further 24 h. The percentage of cells in the sub-G1 phase was quantified and is represented in the graph. (Bottom panel, lanes 1–8) Cell extracts were subjected to immunoblot analysis. Error bars represent the standard deviation obtained from three independent experiments.

