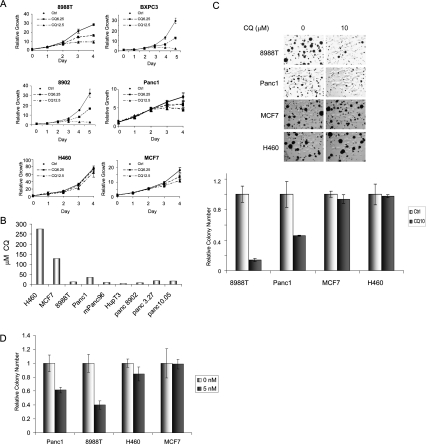
Figure 3.
Inhibition of autophagy in PDAC cell lines attenuates growth and tumorigenicity in vitro. (A) Growth curves of four different PDAC cell lines (8988T, BXPC3, 8902, and Panc1) and control cell lines H460 and MCF7 treated with CQ (6.25 μM and 12.5 μM) to inhibit autophagy or with PBS as a control. The PDAC cells showed a dose-dependent robust suppression of growth, whereas H460 and MCF7 cells with low basal autophagy were only minimally affected. (B) IC50 of CQ in micromolar in a panel of PDAC lines and H460 and MCF7 cells. Note the low IC50 values for the PDAC lines as compared with MCF7 and H460. (C) Soft agar assays were performed to assess for the ability of CQ (10 μM) to inhibit anchorage-independent growth. Colony formation was suppressed in 8988T and Panc1 cells, but not MCF7 and H460 cells. The histogram below shows quantitation of these assays relative to untreated cells. Error bars represent triplicates. (D) Bafilomycin A1, an inhibitor of lysosomal acidication and autophagy, attenuates PDAC anchorage-independent growth. Cells were seeded in soft agar and treated with 5 nM bafilomycin A1 (charcoal bar) or vehicle (light-gray bar). Data are expressed relative to control, with error bars representing standard deviations of triplicates. Note the robust reduction in Panc1 and 8988T PDAC cells but not in H460 and MCF7 cells.

