Figure 5.
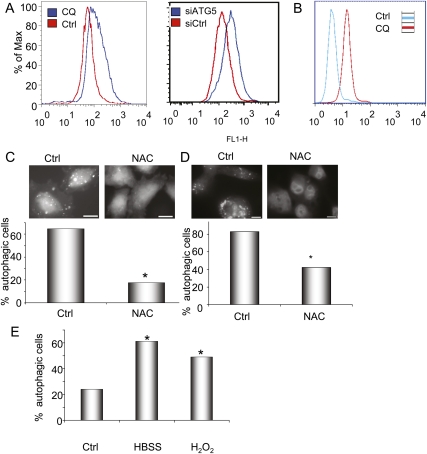
Autophagy is regulated by ROS in PDAC. (A) The left panel shows 8988T cells treated with CQ (25 μM) to inhibit autophagy and stained with DCF-DA to determine ROS levels by measuring fluorescence by FACS. Note the greater ROS levels, indicated by the increased fluorescence upon CQ treatment (blue curve). The right panel shows a similar increase in ROS when autophagy is inhibited by siRNA to ATG5. (B) Inhibition of autophagy by treatment with CQ increases mitochondrial ROS, as evidenced by increased MitoSOX staining. (C) Treatment of 8988T PDAC cells with 3 mM NAC diminishes basal autophagy, shown by the disappearance of GFP-LC3-labeled autophagosomes and the presence of only diffuse signal in the top panels. Below, a histogram shows quantitation of these results, expressed as percentage of autophagic cells. Asterisks indicate that the difference is statistically significant (P < 0.05 by Fisher's exact test). (D) Treatment of Panc1 cells with NAC attenuates basal autophagy similar to 8988T cells. The histogram below shows quantitation of the assay, with the asterisk representing a statistically significant decrease compared with control by Fisher's exact test (P < 0.05). (E) Treatment of HPDE immortalized human ductal cells with 0.5 mM hydrogen peroxide (H2O2) leads to a significant increase in autophagy, shown by a significant increase in GFP-LC3 autophagosomes (asterisks show a significant difference as compared with control by Fisher's exact test; P < 0.05). (HBSS) Hank's buffered salt solution (serum and amino acid starvation) is included as a control for autophagy induction.

