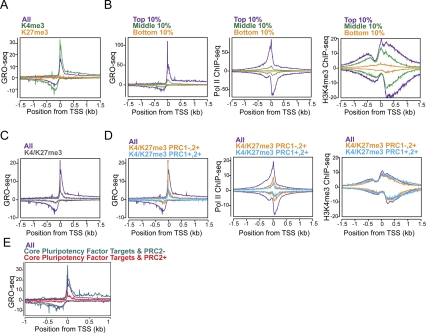
Figure 7.
Regulation of distinct steps in transcription at polycomb target genes. (A) GRO-seq metagene profiles of all genes (purple), the subset of genes marked with H3K4me3 but not H3K27me3 (green), or the subset with H3K27me3 but not H3K4me3 (orange) near the promoters in ESCs (Ku et al. 2008). (B) The composite profiles of GRO-seq, Pol II (8WG16) ChIP-seq (Seila et al. 2008), and H3K4me3 ChIP-seq (Mikkelsen et al. 2007) are shown for genes whose level of expression in the gene bodies are in the top 10% (purple), middle 10% (green), and bottom 10% (orange) of active genes in ESCs, as determined by GRO-seq. The Y-axis is reads per kilobase per million. For ChIP-seq data, the forward and reverse reads are plotted above and below the horizontal axis, respectively. The midpoint between peaks of forward and reverse read density corresponds to the in vivo binding site, as described in Seila et al. (2008). (C) GRO-seq metagene profiles for all genes (purple) and H3K4me3/H3K27me3 bivalent genes (gray) (Ku et al. 2008). (D) Bivalent genes were subclassified into those that have PRC1 (cyan) or not (squash), based on Ku et al. (2008). The composite profiles for each subclass are plotted for GRO-seq, Pol II ChIP-seq, and H3K4me3 ChIP-seq, as in B. (E) The average GRO-seq densities of genes targeted by core pluripotency transcription factors with (sea green; n = 381) or without (red; n = 2,838) PRC2 component SUZ12 co-occupancy in ESCs. The gene lists were taken from Marson et al. (2008).

